Objective:
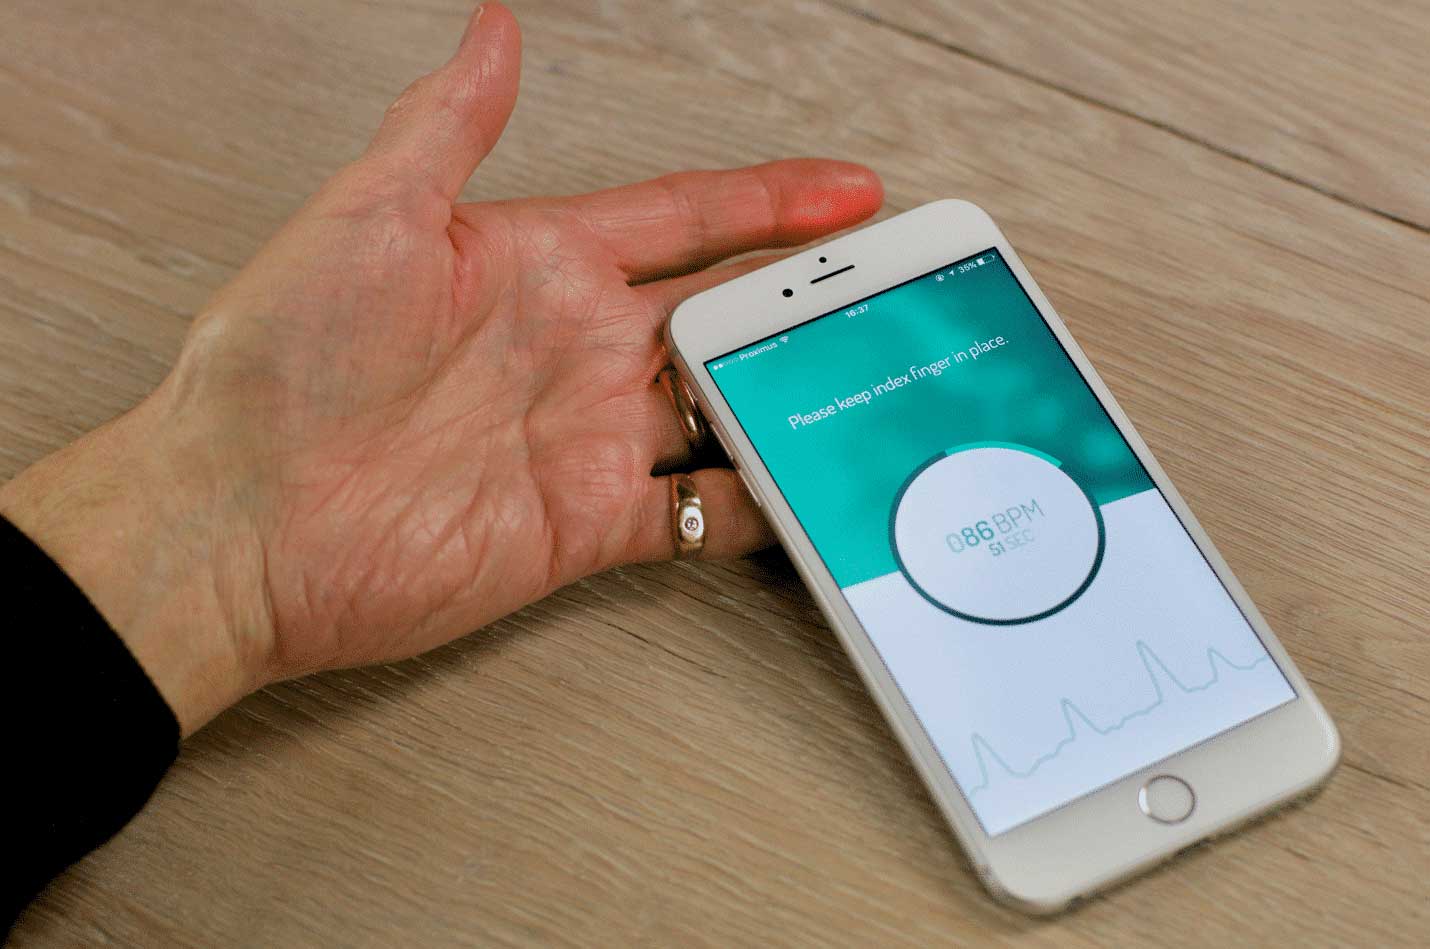
The goal of this document is to demonstrate the correlation between ECG derived heart beats and PPG derived heartbeats and the define the capability of a smartphone to correctly and accurately measure beat-to-beat intervals.
Introduction:
The heart is an electromechanical pump with a rhythmic pumping cycle, in which the electrical activity of the heart can be represented in the electrocardiogram by a P-, QRS-, and T-wave. For heart rate and heart rhythm analysis, the ECG still remains the gold standard. The contraction of the heart propagates a blood pressure pulse wave through the arterial system that travels to the peripheries. A typical arterial blood pressure waveform comprises a systolic upstroke representing the ventricular ejection. After the systolic contraction, the aortic valve closes, which results in a sudden drop in pressure. When the pulse pressure wave is passed, these capillaries relax and eject the excessive blood they accumulated, allowing them to return to their initial state. When the areas with dense capillary beds are studied (ie, fingertips, toes, and earlobes), it is possible to observe this pooling of blood by using optical technologies. This technique is also known as the photoplethysmography (PPG) principle. The relationship between ECG, arterial blood pressure (ABP), and PPG is visualized in Figure 1.
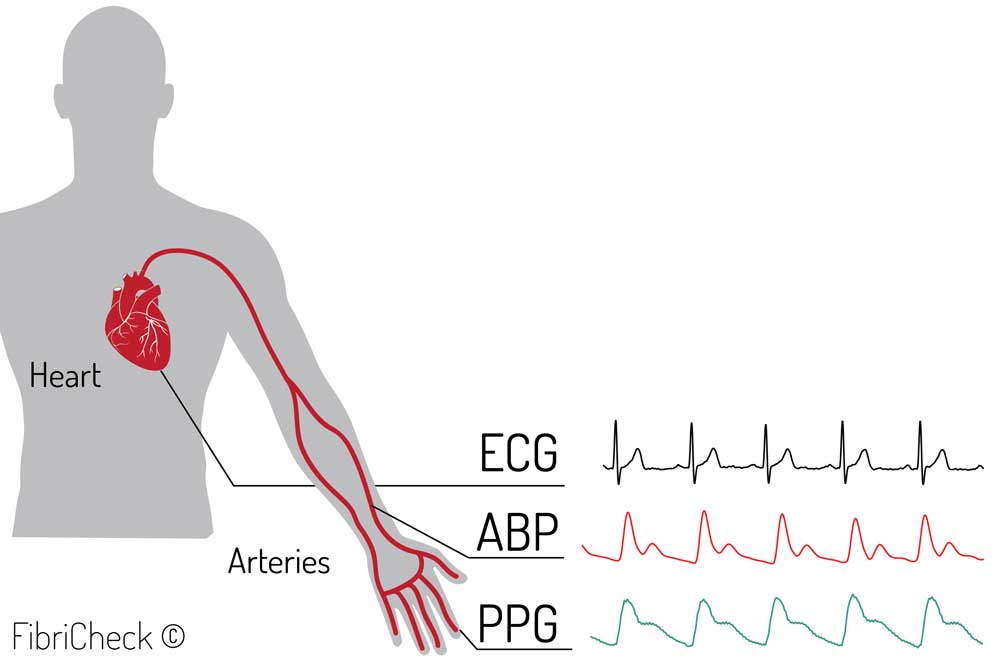
Figure 1: Visualized relation between electrocardiography (ECG), arterial blood pressure (ABP), and photoplethysmography (PPG).
PPG is already used in the clinic to measure oxygen saturation and pulse rate. Additionally, it can also be used to estimate cardiac output. PPG used as signal to measure HR is described as the pulse signal. As such, PPG can be used to measure HR without the need for an ECG device. Furthermore, the HR derived from the PPG signal can be used in a series of calculations to determine the heart rate variability (HRV).
PPG is easy to set up, convenient, simple, and economically efficient. It uses a probe that contains a light source and a photodetector to detect the blood volume pulse. The amount of backscattered light corresponds with the variation in blood volume. Hertzman et al were the first to find a relationship between the intensity of backscattered light and blood volume in 1938.
Traditional PPG systems typically use a narrow wavelength light source (ie, light-emitting diodes [LEDs] with certain colors such as infrared, red, or green) and a specific photodetector to detect PPG signals through the skin. Interestingly, the smartphone camera in combination with the LED flashlight is able to detect these small variations in skin color caused by the blood flow (Figure 2). The camera uses wide-bandwidth pixel-enabling color detection in the red, green, and blue range (RGB-color).
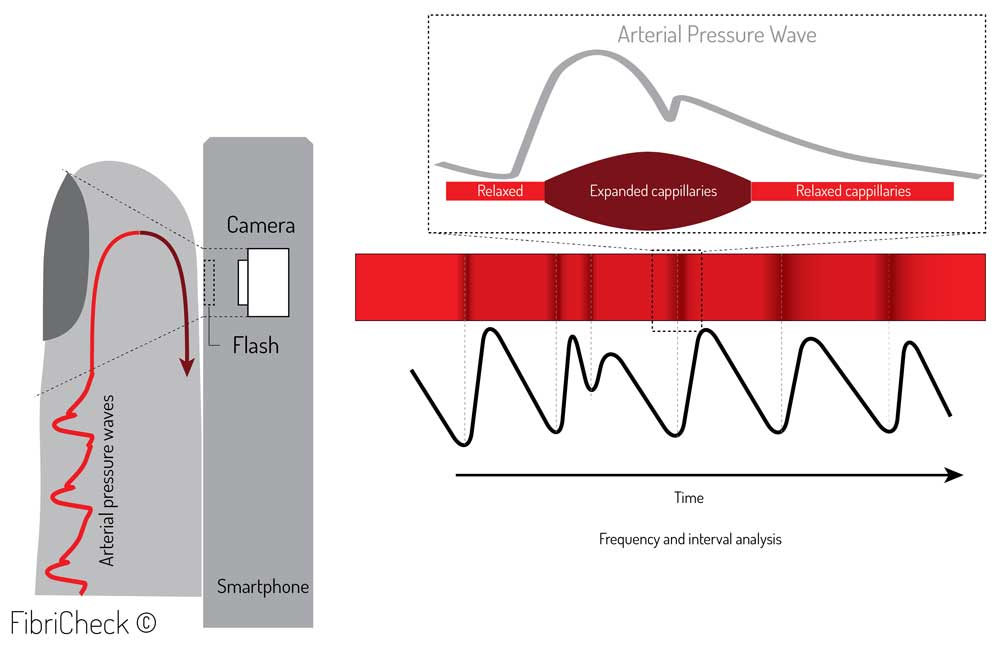
Figure 2. Photoplethysmography (PPG) principle by smartphone.
In 2010, Jonathan and Leahy et al presented a case study which concluded that HR could indeed be measured through PPG by using a smartphone. This case experiment was confirmed by Gregoski et al in 2011. Currently, numerous smartphone apps exist that measure HR. However, the validity of these apps has not always been confirmed due to variations in their heart rate processing algorithms. At this moment, there is no consensus on a gold standard method for the validation of a HR app based on a PPG signal. This results in different validation processes that not always reflect the veracious outcome of comparison. Therefore we validated the performance of our heart rate monitoring capabilities in the most accurate way. Comparing peak-to-peak intervals between ECG and PPG signals as shown in Figure 3.
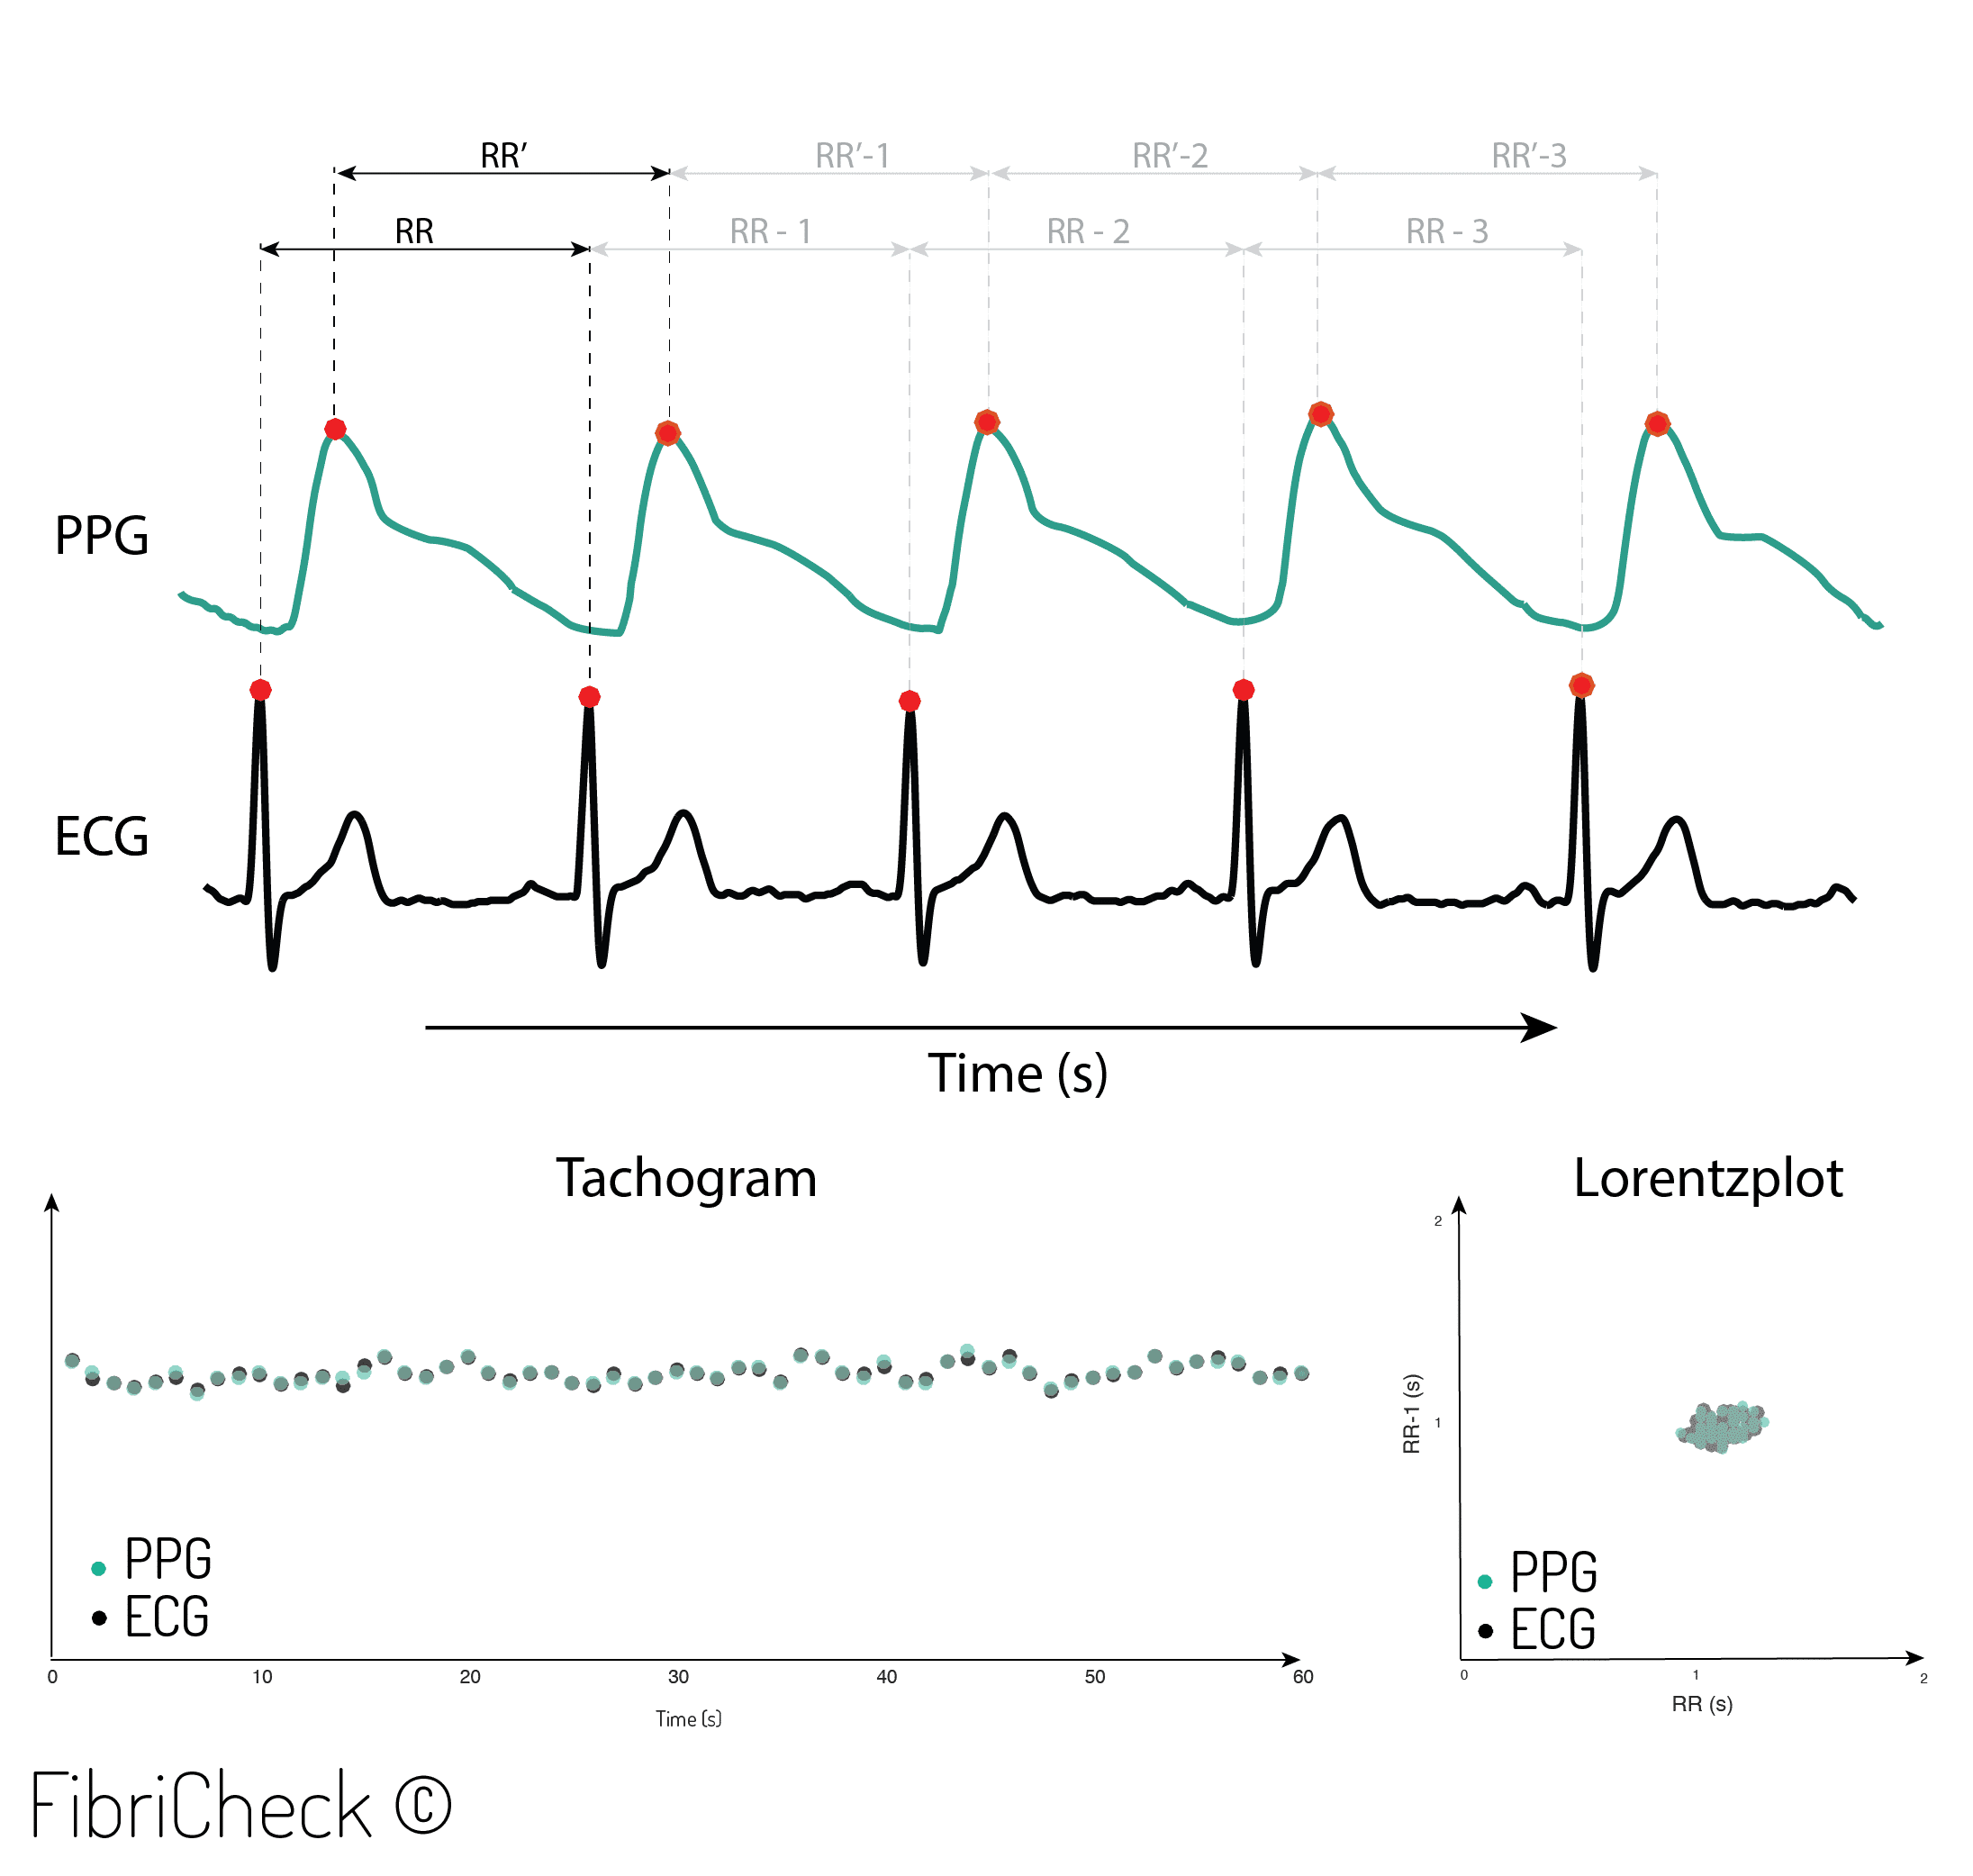
Figure 3. Beat-to-beat analysis from R-R intervals (RRI) and peak-to-peak intervals (PPI).
Methods:
The beat-to-beat accuracy of the FibriCheck app was verified by comparing it with a wearable ECG patch. To do so, the FibriCheck smartphone app was used and installed on an iPhone 5S. This app also enables synchronization of the PPG signal, with a simultaneously measured ECG signal of a single-lead wearable ECG patch. This wearable device was attached to the upper left corner of the patient’s chest with 2 disposable electrodes (Figure 4). This enables comparing the raw data of the 2 devices (ie, FibriCheck and wearable ECG) and measurement principles (ie, PPG and ECG). Inclusion criteria were 18 years or older and able to provide the Dutch written informed consent. Patients with an active pacemaker rhythm were excluded. Patients were included between November 2015 and March 2016.

Figure 4. Experimental set-up between real-time ECG monitoring (A) and synchronised PPG monitoring using the smartphone application (B).
There were 2 sub-sets of data collected: The first was a convenience sample of matched male and female patients over the age of 65 years, with or without a history or diagnosis of atrial fibrillation (AF). All subjects were verified with a 12-lead ECG. Subjects were measured in a sitting position and asked to perform three consecutive measurements of 60 sec.
A second group were subjects in normal sinus rhythm that underwent a sporting session to induce elevated heart rates. This results in a heterogeneous distribution of heart rates since it contains patients with a regular or irregular heart rhythm as well as low and high HR’s. The sports session involved 5 min cycling at a high pace on a stationary exercise bike to reach a maximum HR. Two measurements before and after the exercise were done.
The FibriCheck app converts 60 Hz video data to derive the corresponding PPG signal. Time synchronization between ECG and PPG was automatically done by the FibriCheck app. Through this it was possible to extract the interpeak distance. An example of the automatic synchronization is shown in Figure 5.

Figure 5. Synchronization of electrocardiography (ECG) and photoplethysmography (PPG) signal.
The Kolmogorov-Smirnov test was performed to test for normality. The not normally distributed data are expressed as a median and interquartile range (IQR). A two-sided Wilcoxon signed-rank test was performed to compare two continuous variables for the not-normally distributed data. Correlation between the two continuous variables was calculated by a Spearman correlation test. All analyses were two-sided, and the level of significance was set at a value of .05. Root mean square error (RMSE) and normalized root mean square error (NRMSE) were performed to evaluate the range of errors between predicted and observed values. Data analyses were performed with R statistical software (version 3.2.2). Graphical presentations, such as correlations plots, Bland-Altman plot, and Kernel density plots, were made in RStudio version 0.99.486 (Rstudio Inc).
Results:
A total of 247 subjects were measured with the FibriCheck app for the first subset (n=238) and for subgroup 2 (n=19). The researcher included both healthy subjects (n=12) and patients who were diagnosed with AF by a 12-lead ECG system (n=7). In total 18 patients from the total study population had a pacemaker and were excluded. Therefore, the final study population included 229 subjects. Table 1 shows the characteristics of these patients.
Table 1: Characteristics of patients in study 2
| Variable | Men (n=105) | Women (n=120) | All |
|---|---|---|---|
| Age in years, mean (SDb) | 73.54 (13.86) | 75.51 (14.34) | 74.59 (14.12) |
| Height in centimeters, mean (SD) | 173.79 (8.04) | 161.22 (7.32) | 166.25 (13.79) |
| Weight in kilograms, mean (SD) | 80.3 (13.59) | 67.52 (13.83) | 73.45 (15.11) |
| Diabetic, n (%) | 20 (19) | 24 (20) | 44 (20) |
| Atrial fibrillation, n (%) | 50 (47.62) | 48 (40) | 98 (43.56) |
| Systolic blood pressure in mm Hg, mean (SD) | 128.54 (13.84) | 130.6 (20.34) | 129.65 (17.13)c |
| Diastolic blood pressure in mm Hg, mean (SD) | 74.39 (7.59) | 73.55 (11.10) | 73.94 (9.62)c |
| CHA2DS2-VASc d score, mean (SD) | 3.61 (1.75) | 4.58 (1.86) | 4.13 (1.8 |
aDemographics of 4 patients were reported as missing data.
bSD: standard deviation.
cSystolic and diastolic blood pressure were not included for patients who underwent the sport session.
dCHA2DS2-VASc calculates the stroke risk for patients with atrial fibrillation.
Table 2 provides the study results. In total, 237 measurements (PPG-ECG pairs) were performed, which resulted in a 20,298 beat-to-beat analysis. An average interval of 758 (RRI) and 758 (PPI) was observed.
Table 2: Overview study results.
| Variable | ECG | PPG |
|---|---|---|
| Number of Intervals | 20,298 | 20,298 |
| Average interval (ms) | 758.4 (351.6) | 758.2 (333.3) |
| Minimum value (ms) | 312.5 | 316.7 |
| Maximum value (ms) | 2223.0 | 2233.0 |
The number of intervals for both PPG and ECG are plotted in the correlation plot below where high heart rates are indicated in a black color and Normal/low heart rates are indicated in light grey.
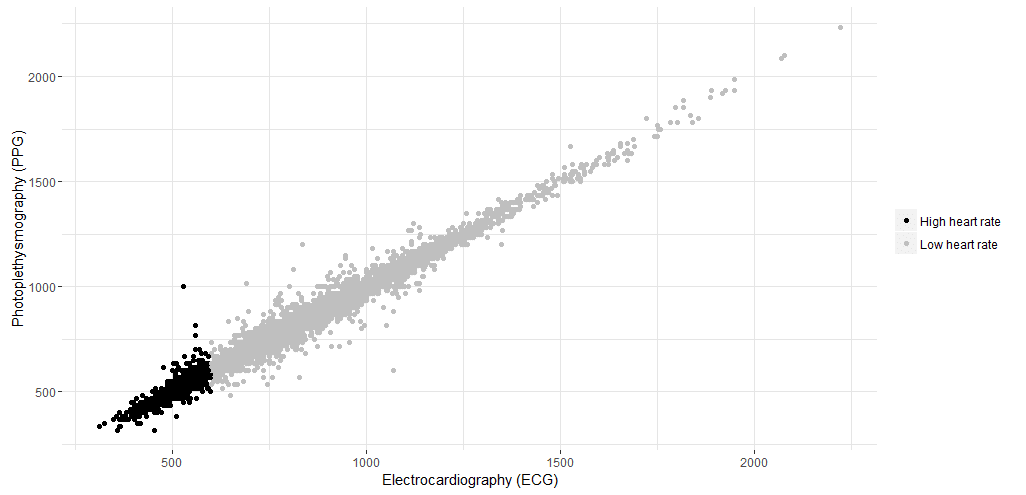
Figure 6. Correlation of intervals for both techniques (ie, electrocardiography [ECG] and photoplethysmography [PPG]) in milliseconds. Gray, high heart rates; Black, low heart rates.
The Wilcoxon signed-rank test showed no significant difference between ECG and PPG (P=.92). To calculate the correlation and difference between the ECG and PPG measurement, the Spearman rank-order correlation, RMSE, and NRMSE were calculated. A correlation of rs=.993 was found, with RMSE=23.04 ms and NRMSE=0.012 ms.
Additionally, a Bland-Altman plot was made, showing the differences between the beat-to-beat intervals of the PPG-ECG pairs in function of the means. The error distribution and the distribution of the mean duration of the intervals of the PPG-ECG pairs are visualized by kernel density plots (Figure 7). The mean bias is 0.26 (23.045) with a 95% CI from −45.82 to 46.35. The CI (μ±1.96σ) is visualized by the dashed lines.
An in-depth analysis was performed to investigate differences within the study results. This detailed analysis was based on two categories: low versus high HR and regular versus irregular intervals. On the basis of the definition by Laskowski of a resting HR a distinction was made between a resting HR (40-100 BPM) and high HR (100-170 BPM). Table 3 describes the study results for this distinction
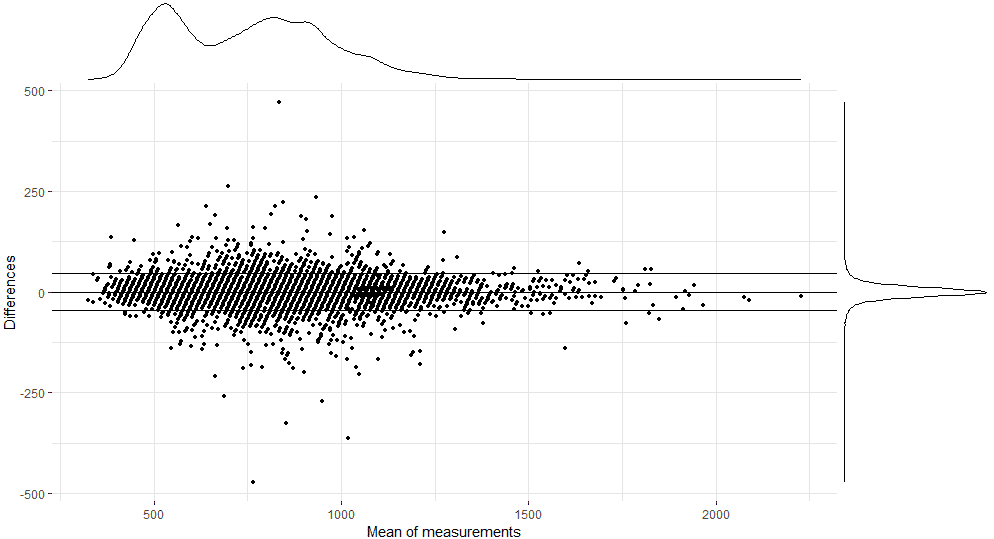
Figure 7. Bland-Altman plot comparing the reference R-R intervals (electrocardiography [ECG]) to the peak-to-peak intervals (photoplethysmography, PPG).
Table 3: Summary of intervals divided in low, high, and overall heart rate.
| Variable |
Interval 40-100 heart rate |
Interval 100-170 heart rate |
||
| ECGa | PPGb | ECG | PPG | |
| Number of intervals | 13,913 | 13,913 | 6385 | 6385 |
| Average interval (ms) | 869.5 (203.2) | 868.9 (200) | 516.4 (70.3) | 516.9 (66.6) |
| Minimum value (ms) | 601.6 | 483.3 | 312.5 | 316.7 |
| Maximum value (ms) | 2223.0 | 2233.0 | 597.7 | 1000 |
No significant difference was observed between both techniques within the interval 40-100 (P=.76) or interval 100-170 (P=.69). Correlation of interval 40-100 between ECG and PPG was strong (rs=.985; RMSE=25.32 ms and NRMSE=0.014). Interval 100-170 was also strongly correlated (rs=.956; RMSE=17.06 ms and NRMSE=0.025). The correlation between both techniques is plotted in Figure 11.
A last step in analysis was performed by investigating the differences between regular and irregular intervals. Figure 8 visualizes the measurements divided into irregular and regular intervals.
Table 4 describes the study results for this category. A total of 2648 intervals were obtained from patients with AF versus 17649 from patients with regular heart rhythms.
Table 4 Summary of intervals divided into regular and irregular beat-to-beats.
| Variable |
Regular |
Irregular |
||
| ECGa | PPGb | ECG | PPG | |
| Number of intervals | 17,649 | 17,649 | 2648 | 2648 |
| Average interval (ms) | 738.9 (204.8) | 738.6 (205.3) | 888.5 (241.4) | 888 (241) |
| Minimum value (ms) | 312.5 | 316.6 | 406.3 | 400 |
| Maximum value (ms) | 1835.9 | 1850 | 2222.6 | 2233.3 |
No significant difference was observed between both techniques within group regular HR (P=.9204) or group AF (P=.9252). Correlation for group regular between ECG and PPG was strong (rs=.994; RMSE=20.49 ms and NRMSE=0.013). Group irregular was also strongly correlated (rs=.9832; RMSE=37.62 ms and NRMSE=0.021). The correlation between both techniques is plotted in Figure 8.
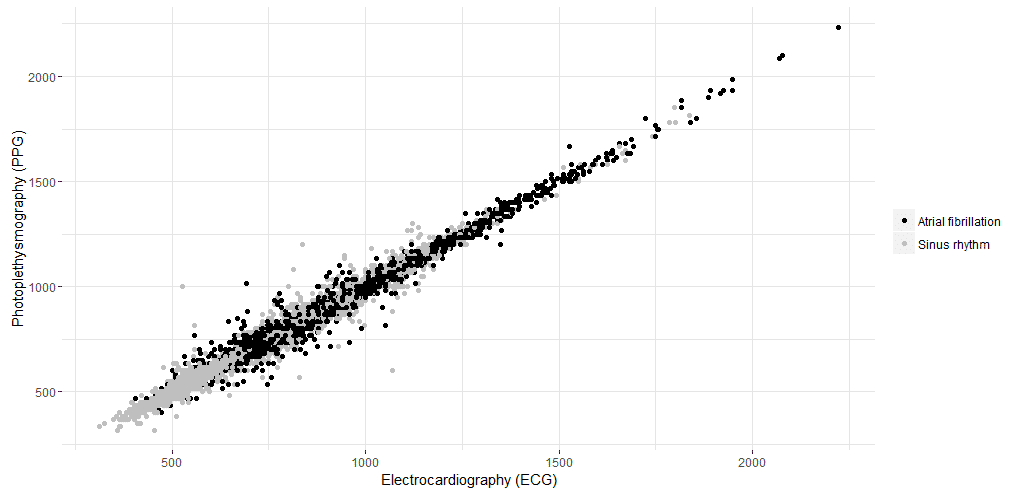
Figure 8. Correlation of intervals for both techniques (ie, electrocardiography [ECG] and photoplethysmography [PPG]) in milliseconds. Gray, irregular intervals; Black, regular intervals.
References:
- Techcrunch. Smartphone users globally by 2020, overtaking basic fixed phone subscriptions 2015 URL: https://techcrunch.com/2015/06/02/6-1b-smartphone-users-globally-by-2020-overtaking-basic-fixed-phone-subscriptions/ [WebCite Cache ID 6si3uHw3X]
- Pelegris P, Banitsas K, Orbach T, Marias K. A novel method to detect heart beat rate using a mobile phone. 2010 Presented at: Annual International Conference of the IEEE Engineering in Medicine and Biology Society; August 31, 2010; United States. [doi: 10.1109/IEMBS.2010.5626580]
- Politi MT, Ghigo A, Fernández JM, Khelifa I, Gaudric J, Fullana JM, et al. The dicrotic notch analyzed by a numerical model. Comput Biol Med 2016 May 01;72:54-64. [doi: 10.1016/j.compbiomed.2016.03.005] [Medline: 27016670]
- Friberg L, Engdahl J, Frykman V, Svennberg E, Levin L, Rosenqvist M. Population screening of 75- and 76-year-old men and women for silent atrial fibrillation (STROKESTOP). Europace 2013 Jan;15(1):135-140. [doi: 10.1093/europace/eus217] [Medline: 22791299]
Created on juni 20th, 2019 at 01:59 pm
Last updated on oktober 29th, 2020 at 02:48 pm


