
FibriCheck enables you to receive several reports on your measurements. Handy to keep a bird’s eye view of your heart rhythm, while also making it easy to share your results with your doctor, if necessary.
As FibriCheck believes it is important that you properly understand the results of your measurements, this article explains the reports you may get from us.
Which reports can I get from FibriCheck?
The FibriCheck app provides two kinds of reports. A report for a particular measurement, or a report which gives you an overview of the measurements you have performed over a given period of time.
The report of a specific measurement
The information contained in the report on one specific measurement is always analysed by our medically certified algorithm. Your results can also be checked by our team of medical experts by way of confirmation. As a Premium user, abnormal measurements are automatically forwarded for verification. Both Premium and Essential users can also request a review for a specific measurement. Measurements which our experts have confirmed as being abnormal also include a call to action.
The periodical report
A periodical report provides you with an overview of the results of your measurements over a particular time span and suggests the kind of action you would do well to take. This type of report may be sent to you on a weekly and monthly basis if you have a Premium subscription. When you are using FibriCheck on prescription, you are also sent a periodical report when your prescription ends.
Where do I find my reports?
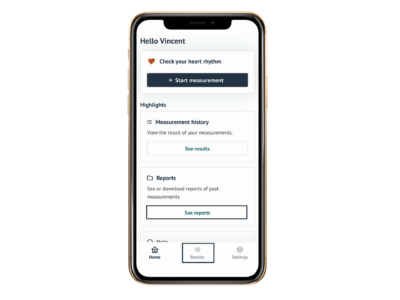
You will find your weekly, monthly and final reports in the FibriCheck app under the ‘Reports’ tab on the start-up screen.
From the start-up screen in the app, you can also go to ‘Results’. This is where you will find a chronological overview of all measurements you have carried out. To view a report for a particular measurement, simply select a specific measurement and press ‘View report’ at the bottom of the screen.
What do our reports look like?
The weekly and monthly reports you are sent as a Premium user are broken down into four major blocks, i.e. your results and a call to action, educational information, statistics and detailed results.
1. Results and Call To Action
The first section of your report shows your results, and also tells you right away which kind of action you would do well to undertake. This involves various possibilities:
- No action required (green): We have analysed your measurements and did not detect any significant abnormalities.
- No immediate action required (orange): Our algorithm established mild abnormalities in your heart rhythm in one or several measurements. It is advisable to show your doctor the results on your next visit.
- Action required (red): Our algorithm has detected abnormalities which point to atrial fibrillation (auricular fibrillation) or atrial flutter. These disorders are associated with a heightened risk of stroke. We strongly advise you to contact your doctor as soon as possible.
If our algorithm has detected a potential heart rhythm disorder, this section also has further information about this heart rhythm disorder.

You are then also shown an overview of factors that are important in order to gain an understanding of your heart rhythm, such as:
- Your highest, lowest and average heart rate over this time period
- The number of measurements you have performed and how these are categorised
- An overview of the symptoms you have specified
- A graph detailing your heart rate and heart rhythm
The mean results of other users of the same age and gender by way of comparison.
2. Education and information
This section of your report has further information relating to the heart and heart rhythm disorders.
3. Statistics and insights
This section of your FibriCheck report gathers all the information about your cardiovascular risk profile. Based on the questionnaire you filled in on the app, we worked out your rate of risk of developing atrial fibrillation or a stroke. Do bear in mind that this is a snapshot of a given period and that your risk profile may change over time.

If you have not completed the questionnaire yet, that is not a problem. You can do so by opening ‘Settings’ in the FibriCheck app. Next, press ‘Medical background’ and answer the questions.
This section of your report also contains an analysis of the way you use FibriCheck. To make the most of FibriCheck, we would advise you to measure your heart rhythm twice a day and whenever you are experiencing symptoms, unless your doctor recommends otherwise. This analysis is to help you achieve this goal. If you are using FibriCheck to optimum effect, you should achieve a score of 100%.

If you have been running fewer measurements than we recommend, it may be a good idea to set yourself reminders. Setting reminders means you are sent notifications to use FibriCheck at the times chosen by you. You can set reminders by opening ‘Settings’ in the FibriCheck app. Next, press ‘Measurement reminders’ and set yourself reminders at the times that are most convenient for you.
Last but not least, this section also has a calendar that shows the number of measurements you have performed on a day to day basis. Each dot on the calendar is a measurement, with the dot colour showing how your heart rhythm was doing.
Alongside green, orange or red dots, it may also be that a measurement gets a blue label. Blue means that the quality of your measurement was of inadequate quality to perform a detailed heart rhythm analysis. If this problem persists, observe the tips in this article.
4. Detailed results
The final part of your FibriCheck report has a detailed overview of all measurements you have carried out over this time span. For each measurement, you will find a brief summary of your heart rhythm and heart rate. This section also has 3 graphs that provide your doctor with further details of your heart rhythm:

- PPG signal: FibriCheck measures your heart rhythm by way of a photoplethysmogram (PPG). This technology measures your heart rhythm by looking at the changes in the amount of blood that is being pumped through your blood vessels. We do so by using the torchlight on your smartphone and the small blood vessels in the tip of your fingers. The graph of the PPG signal visualises this change in the amount of blood.
- Tachogram: This is a widely used visual technique that charts the time difference between each heartbeat. If you have a regular heart rhythm, the various dots should make up a single line. If the tachogram looks uncontrolled or shows spikes, this may indicate a heart rhythm disorder.
- The rhythm print: This graph is also referred to as the Lorenz plot or Poincaré plot. It compares each heart rate measurement with the previous measurement. Where the various dots combine into a cluster, this means you have a regular heart rhythm. If they are scattered across the graph, this may point to atrial fibrillation.
Created on May 25th, 2022 at 01:23 pm
Last updated on May 24th, 2023 at 09:57 am
Related Posts

FibriCheck’s new weight logging feature
At FibriCheck, our goal is to empower you to take control of your heart health.…

The progression of atrial fibrillation
Atrial fibrillation is a progressive disease, meaning that the symptoms and the severity of the…

What is Postural Orthostatic Tachycardia Syndrome (PoTS)?
Postural Orthostatic Tachycardia Syndrome, also known as PoTS, is a condition in which the heart…