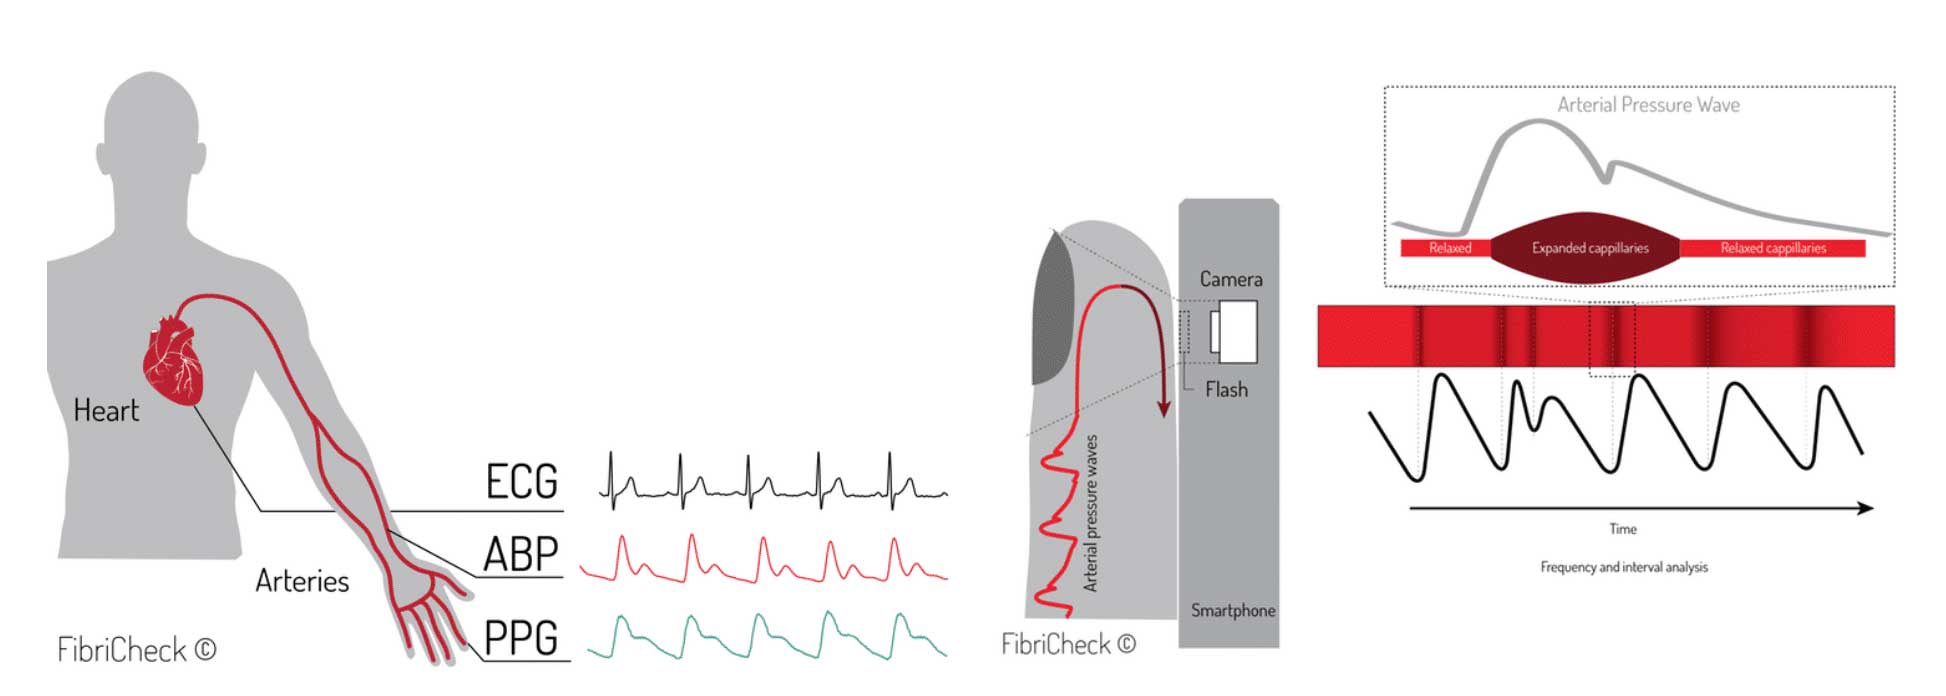
The heart is an electromechanical muscular pump that, in a normal situation, has a rhythmic contraction when an electrical stimulus triggers the heart cells to contract. This electrical signal is also called the electrocardiogram, or ECG for short. After every P-QRS complex, a mechanical action is triggered causing the ejection of blood into the arteries. This causes an arterial blood pressure (ABP) wave that propagates to the extremities of the body. When this pressure wave arrives in the finger tips, it will expand the capillaries and therefore pool more blood (i.e. more volume in the capillaries).
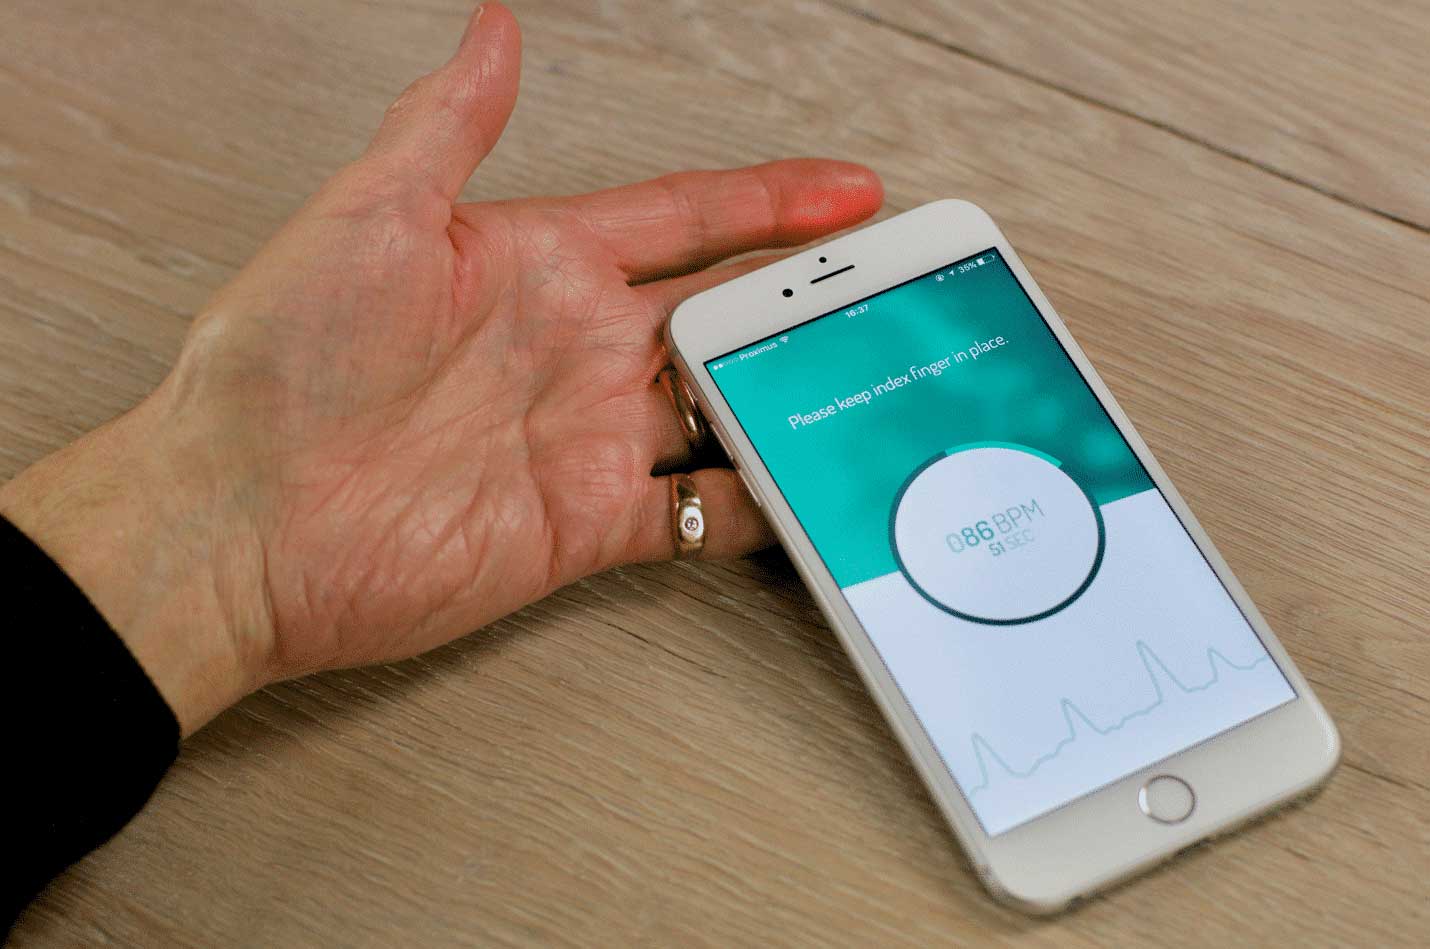
“FibriCheck uses the camera of the smartphone to detect small changes in light absorption in the subcutaneous capillaries of the fingertip to measure your cardiac rhythm.”
When illuminating the finger with a smartphone flashlight and monitoring the reflected light through the camera, it is possible to observe these slight variations in absorption due to the pooling of the extra blood volume. Monitoring these changes in function of time creates a time series of consecutive absorption bands that can be converted into a interpretable signal, called the photoplethysmogram or PPG.

This photoplethysmogram enables you to monitor heart rate and since 1938, when the phenomenon of PPG was first discovered, this principle has been used throughout the medical and wellness space. The most common examples of PPG are the pulse-oxygen devices you place on your finger to monitor oxygen saturation or sport-watches that monitor your heart rate.
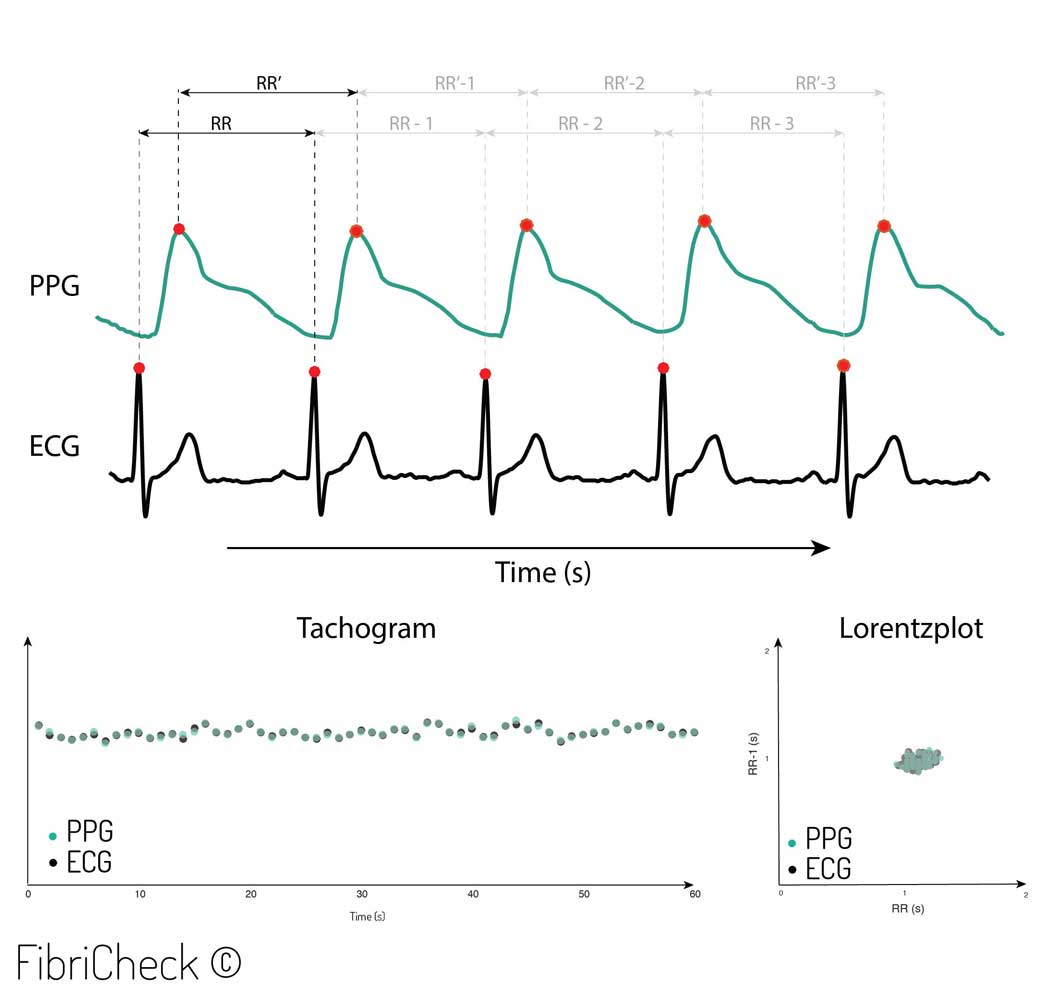
When you take a closer look at what PPG has to offer, you will see it reflects the changes in volumetric effects. This means that, with the periodicity of heart rate, this volumetric effect is repetitive and there is a good correlation between the electrical signal that triggers the heart to contract and the volumetric response that is caused by the ejection of the blood in the heart. This correlation is studied in depth in one of our science posts. In the figure below is an example of a PPG signal together with an ECG signal. Note that there is an offset between the ECG and PPG which is due to the pulse arrival time, i.e. the time it takes for the blood pulse to leave the heart and arrive at the measurement location. However, the intervals between two consecutive pulses (RR) and (RR’) are exactly the same!
This means that, if you study the PPG in a beat-to-beat fashion, you are not only capable of detecting the heart rate but can also observe variations in the beat-to-beat variability and have the possibility to detect heart rhythms and the deviations these present.

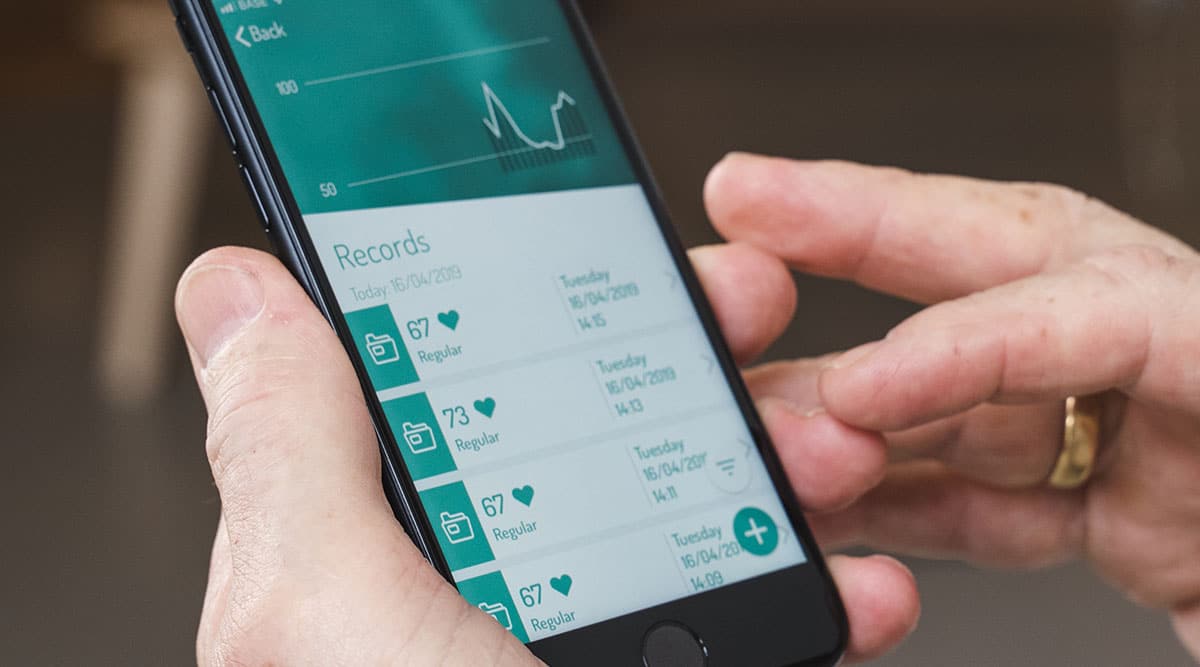
This is exactly what FibriCheck is doing. It is monitoring each beat-to-beat interval with the highest accuracy possible to define what kind of arrhythmia is present. For this we have state-of-the-art machine learning algorithms that automatically interpret these results and create an output towards the healthcare professional, who can visually confirm these findings. For this visualisation we learned there is triangle of information required:
- The raw data represents the signal and the quality over the entire measurement period of 60 seconds
- The tachogram represents an indexed based time representation of the distance between each heartbeat. It plots the RR interval
- The Lorentz plot representing a 2 dimensional representation to look at the clustering patterns between the current and the previous RR interval

Based on this output FibriCheck is capable of detecting and differentiating normal rhythms, atrial fibrillation and other arrhythmia’s.
Created on June 25th, 2019 at 12:27 pm
Last updated on July 24th, 2024 at 08:14 am


